Scan Results
List of Scan Results
Select Scan results to see a list of all scans performed. The results of all scans can be found here. Each scan is represented by one line. Scan results are automatically updated every 10 seconds. This frees the user from having to refresh the page manually.
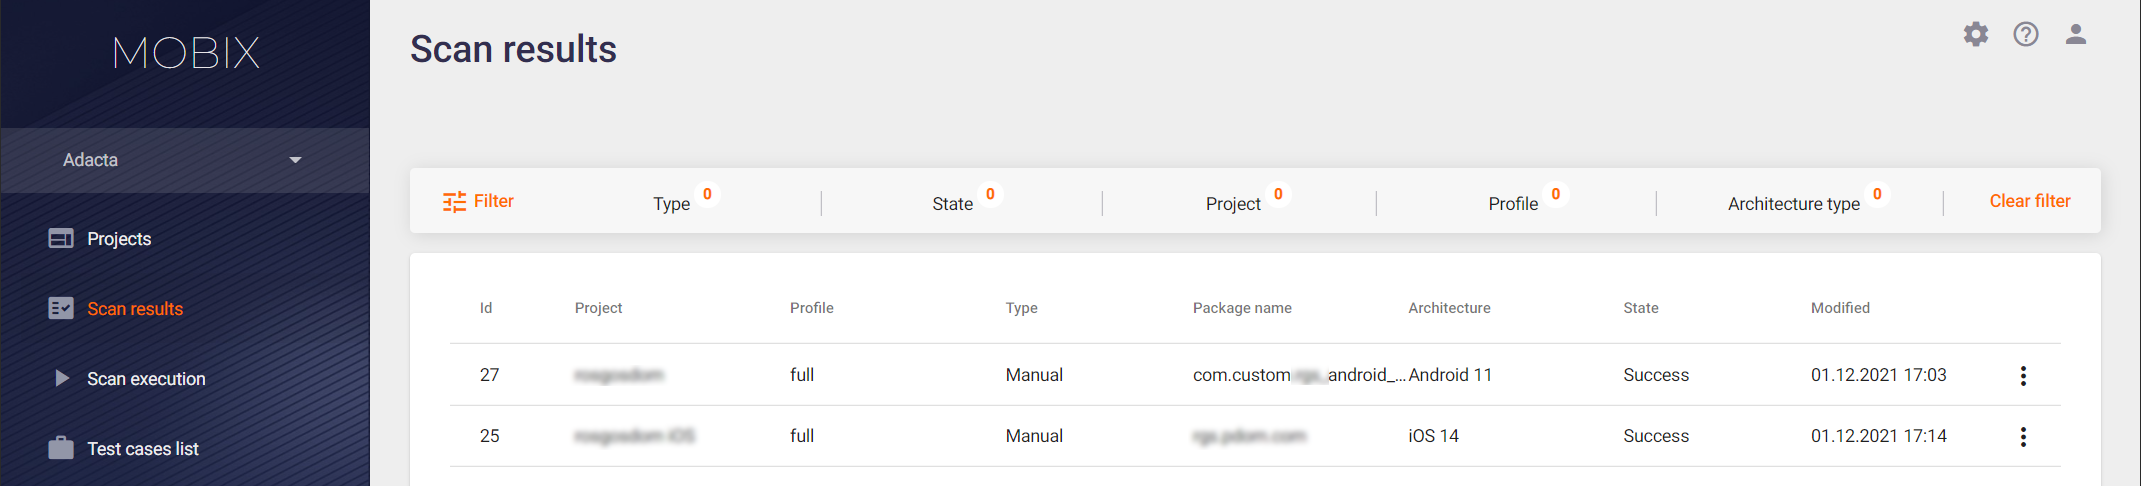
The list shows scans sorted by the scan Id. The list contains the following information:
- Id — Internal scan ID.
- Project — The name of the project where the scan was performed.
- Profile — Scan profile used for application analysis.
- Type — Scan mode (Manual test or Auto test).
- Package name — The name of the analyzed application in Android.
- Architecture — The architecture type for which the test case was recorded (Android or iOS).
- State — Scan status, can have several values:
- Success — The scan was completed successfully and without errors. If the scan as a whole was successful, but there were failures in some modules, a
 icon is displayed next to the status. If you hold the mouse cursor over it, more detailed information about the error will be displayed.
 - Created — the scan is created.
- Starting — scanning is running, the target application is being installed and launched.
- Started — the scanning process is in progress.
- Analyzing — the scanning is ended, the process of analyzing the collected information is performed.
- Canceling — the scan was started, but a termination was initiated via the drop-down menu on the right.
- Canceled — the scan is canceled using the drop-down menu on the right.
- Failed — The scan was completed with an error. The
 icon is displayed next to the status. If you hold the mouse cursor over it, more detailed information about the error will be displayed.
- Success — The scan was completed successfully and without errors. If the scan as a whole was successful, but there were failures in some modules, a
- Modified — the scan start time.
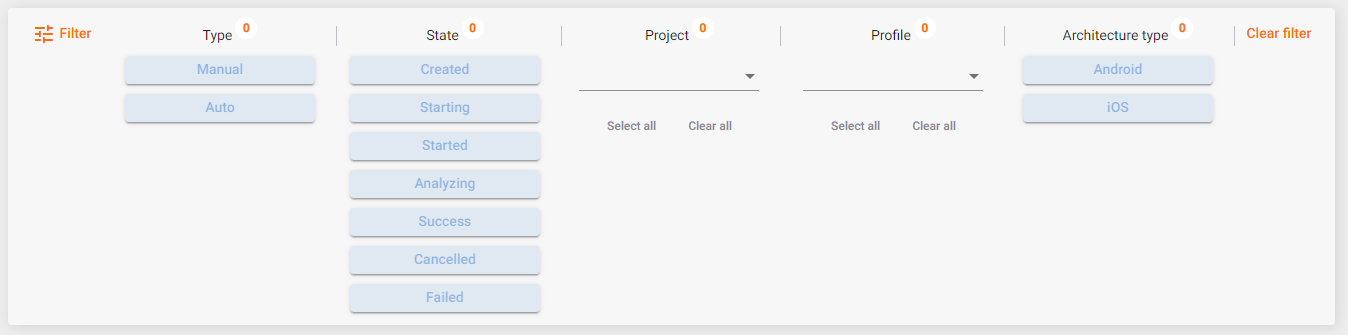
You can use a filter to display only the results you need. When you select multiple filters, they work together. For example, if you select the Manual type and the Success state, all successful manual scans will be found and displayed.
Click a string in the Scan results table to go to the detailed results of the selected scan.
You can also download a PDF scan report, initiate re-analysis of the scan results, or delete scan results from this page. Use the drop-down menu on the right side of the scan results string to perform these actions.

Scan Result
To go to the Scan result page, click the string of the selected scan on the Scan results page. This page contains all the information about the analysis of the application: the vulnerabilities detected, the data collected during the application's operation, and compliance with the standards and requirements. There are four or five tabs available for selection, depending on the type of scan: General information, Defects, Collected data, Requirements, View video record.
General Information
The General information tab contains information about the performed scan and brief information about the scanned application.
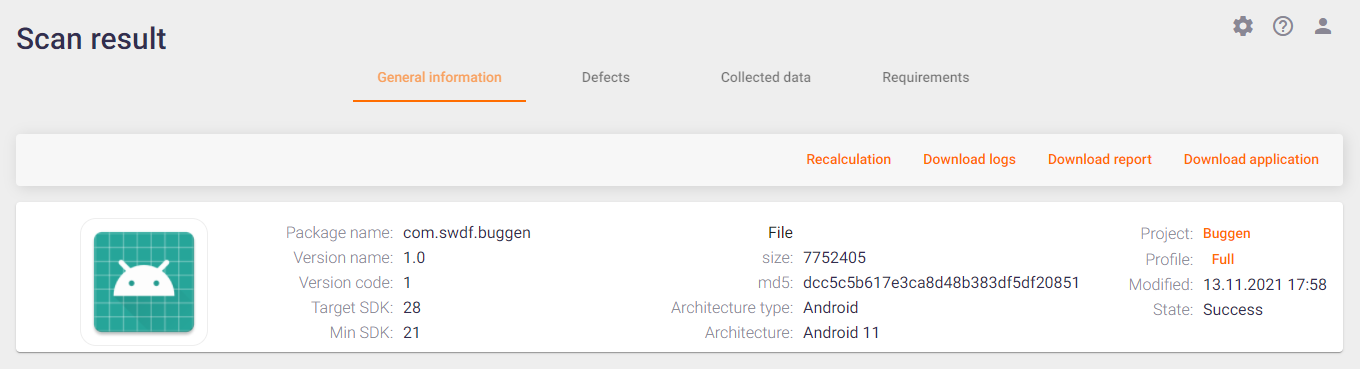
This tab contains general scan information, including the following:
- Package name — Name of the application package in the system.
- Version name / Version code — Application version specified in the application manifest for more precise identification of the analyzed application / Version of the application code used by the application developers.
- Target SDK/Min SDK — Target and minimum versions of the Android SDK to build the application.
- File — Information about the application file.
- Size — The application file size.
- md5 — The hash sum of the application file.
- Architecture type / Architecture — Architecture of the scanned application (Android / iOS).
- Project — Name of the project the scan was performed for. This value is a link, by clicking it you can go to the corresponding project.
- Profile — Scan profile used for application analysis. This value is a link, by clicking it you can go to the corresponding scan profile.
- Modified — Scan date.
- State — Scan status.
- Test case — The name of the test case used (applicable for auto tests only).
The buttons in the upper right corner allow you to perform the following actions:
- Recalculation — Re-analyze the scan results using the latest analysis rules for the application.
- Download logs — Download the scan log file.
- Download report — Get a detailed report on the results of the scan in PDF format.
- Download application — Download the file of the application scanned.
Defects
For each vulnerability detected, the system creates a defect. A list of all defects found during the scan is shown in the left half of the Defects tab. The right side of this tab provides information about the detected vulnerability with a detailed description of the vulnerability, as well as recommendations on how to fix it.

For the convenience of working with defects, you can select and apply a filter to the displayed defects. To do this, click the Filter button in the upper left corner and select one or more values from the drop-down lists to filter by Severity, Status and State. If you select the High severity level and the Confirmed status, all confirmed defects with high severity will be displayed. Click the Clear Filter button on the right to remove the selected values from the filter. Click the Filter button again to hide the filtering field.
The Defects tab provides the following information about defects:
- The ID of the defect in the system.
- Vulnerability - a requirement that is violated because of this Defect.
- Defect severity:
- «
 » — Critical;
 - «
 » — High;
 - «
 » — Medium;
 - «
 » — Low;
 - «
 » — Info.
- «
- Defect status:
- «
 » — Confirmed;
 - «
 » — False Positive;
 - «
 » — Not Set.
- «
The system automatically fills in the values of the defect fields during the analysis of the results.
Click a defect in the left half of the Defects tab to get detailed information about the defect on the right side.
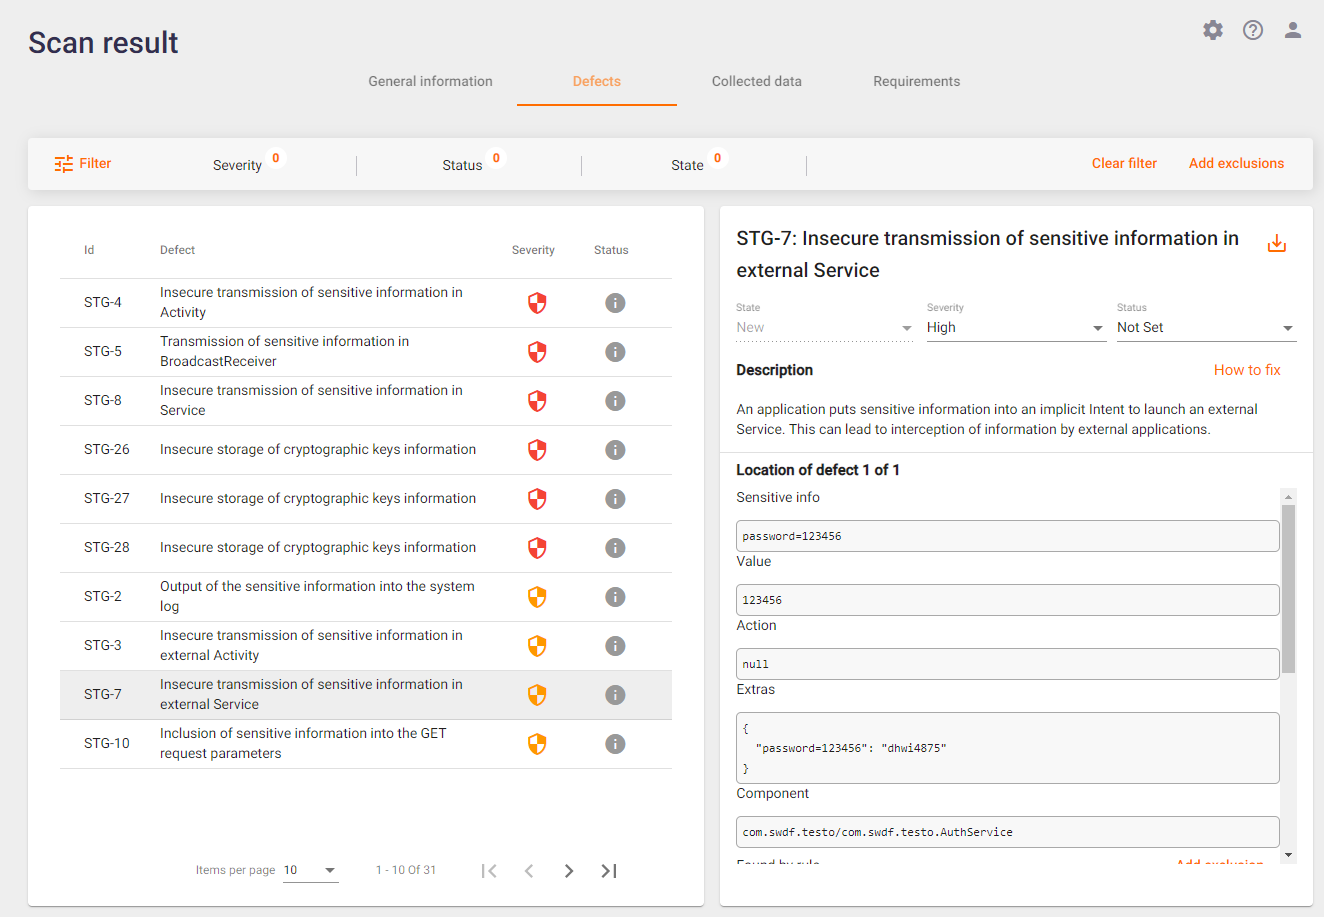
The following information is provided:
- Defect ID in the system.
- Name of the detected vulnerability. Next to the name is the
 icon. If you click on it, you can download the vulnerability report in PDF format.
 - State of the defect:
- New — If the defect was first found during this scan, or if it had already occurred before, and then the problem was solved and the defect was closed, but reappeared during this scan.
- Recurrent — If the defect has already been found during previous scans.
- Fixed — Is the state for those defects that were found in previous scans, but are no longer present in the current scan.
- Severity of the defect. This field displays the current value of the defect severity. It provides the opportunity to change the severity by selecting a new value from the drop-down list. It is important to note that when the severity level is changed, the defect automatically receives the status "Confirmed". By assigning a severity level to a defect, we acknowledge that it exists.
- Status of the defect. This field displays the current status of the defect. It is possible to change the status by selecting a new value from the drop-down list.
- Description of the defect briefly describes the vulnerability found. Next to the description there is a link to a Wiki page with a detailed description of the vulnerability, recommendations on how to fix it, examples of source code, and links to materials on this vulnerability.
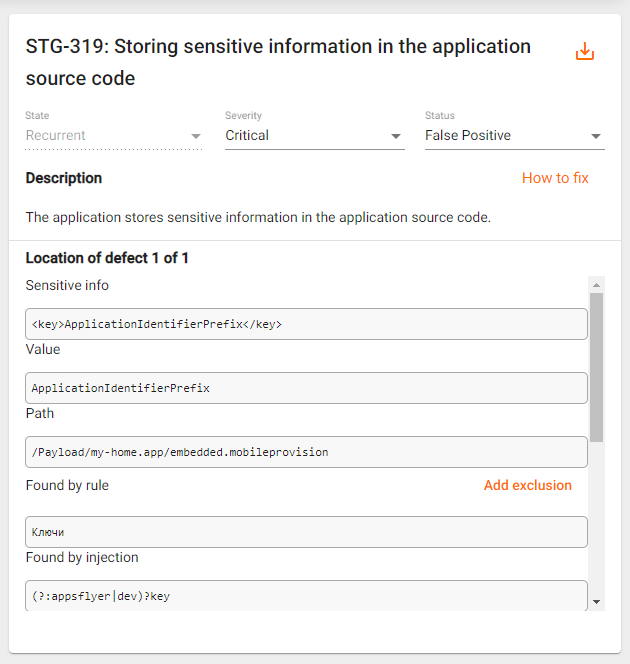
Note: Special mention should be made of the defects detected by the "Search for previously found sensitive information" module. The Description field of such defects, in addition to the information mentioned above, contains a link to the vulnerabilities (View details), that caused the creation of such a defect (more detailsmore details).
- Location of defect. If several vulnerabilities of the same type are detected, they are grouped into one vulnerability. Arrows appear to the right of this field. You can use them to navigate between the vulnerabilities. Below is important information about the vulnerability found, such as the sensitive information found, where it was found, etc.
- The Result field displays a code fragment or the contents of the file (up to 5000 characters) where the vulnerability was detected. If you want to download the entire file, click the Download link on the right.
If the analysis finds vulnerabilities that we define as false positives, they can be added to both project-level and company-level exceptions (for all projects in the company). To do this, select one or more detected defects, change their status to "False positive" and click the Add exclusions button located in the upper right corner of the Defects tab of the Scan result window.

In the Add exclusions window that appears, select whether you want to add exceptions at the project or company level, and click the Add button.

You can also add an exception for a particular vulnerability by clicking the Add exclusions button next to the Found by rule heading in the vulnerability description.
In the Add exclusions window that appears, select whether you want to add exceptions at the project or company level, and click the Add button.
By adding exceptions, such vulnerabilities will not be considered when re-analyzing the results or the next scan within this project, if the project level is selected, or for all projects of a company, if the company level is selected.
Collected Data
The Collected data tab provides access to all data collected during the application scan. The information is divided into modules that are responsible for collecting various data. For each module it is possible to download the collected data as a zip archive by clicking the Download module’s data button. It is also possible to download all the collected data at once in one archive using the Download all data button.
Select the Collected data tab on the Scan result page to work with the data collected during the application scan.
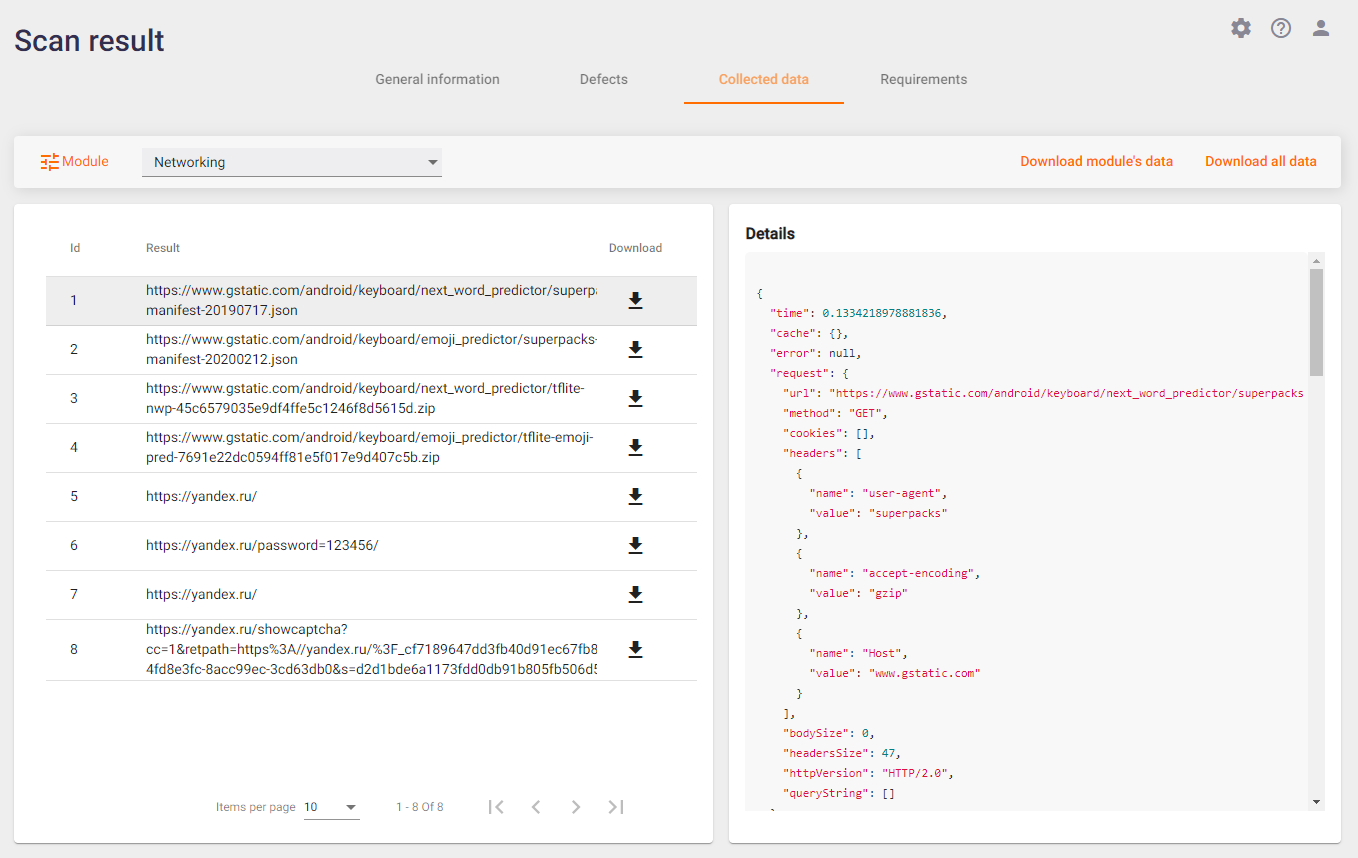
This tab contains the data collected during a scan of the application by all modules included in the profile. To view the data collected by a particular module, select it from the drop-down list in the upper left corner. Each of the modules collects data specific only to it. Accordingly, the format of data representation on the tab is different for each module.
The figure above shows the data collected by the Networking module. In this example, the data transmitted over the network was captured, including address, host, protocol, time, method, port, and the content of the request and response. This kind of additional "raw" information can be useful when working with the results of the analysis.
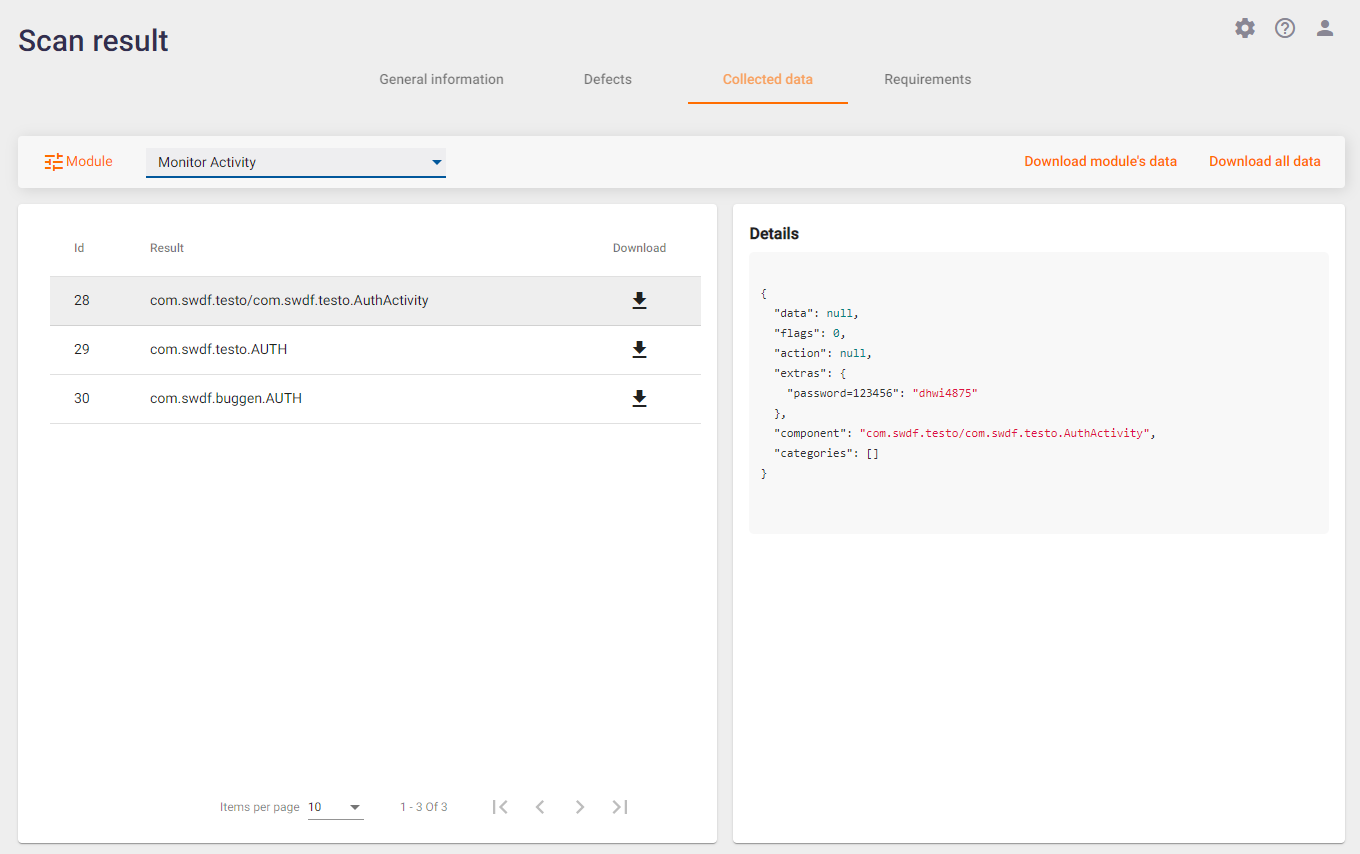
Another example is shown in the figure below. It illustrates another area of application work, in particular, data collected by the Monitor Activity module. The term "activity" here refers to all the various application screens that were run during the scan. For each screen (or "activity") its name and launch parameters are shown.
All data from different modules, i.e. from different areas of the application, are collected and available for processing in one system. This greatly simplifies data analysis compared to the usual situation where different types of data are collected by several different utilities in different formats during the scan and it is often impossible to run these utilities in parallel to collect data at once.
The collected data is used to enable the user to work directly with it when analyzing the results. The system also uses it to draw conclusions about application vulnerabilities. The rules for analyzing collected data to find vulnerabilities are described in detail in the Rules sections of the User Guide and Company-level Analysis Rules of the Installation, Setup, and Integration Guide.
Requirements
On the Scan result page, select the Requirements tab to work with the requirements. This tab displays the results of the requirements compliance check of the analyzed application. The Requirements tab presents compliance with the security standards selected in the scan profile. Requirements and standards with identified non-compliances are marked in red.
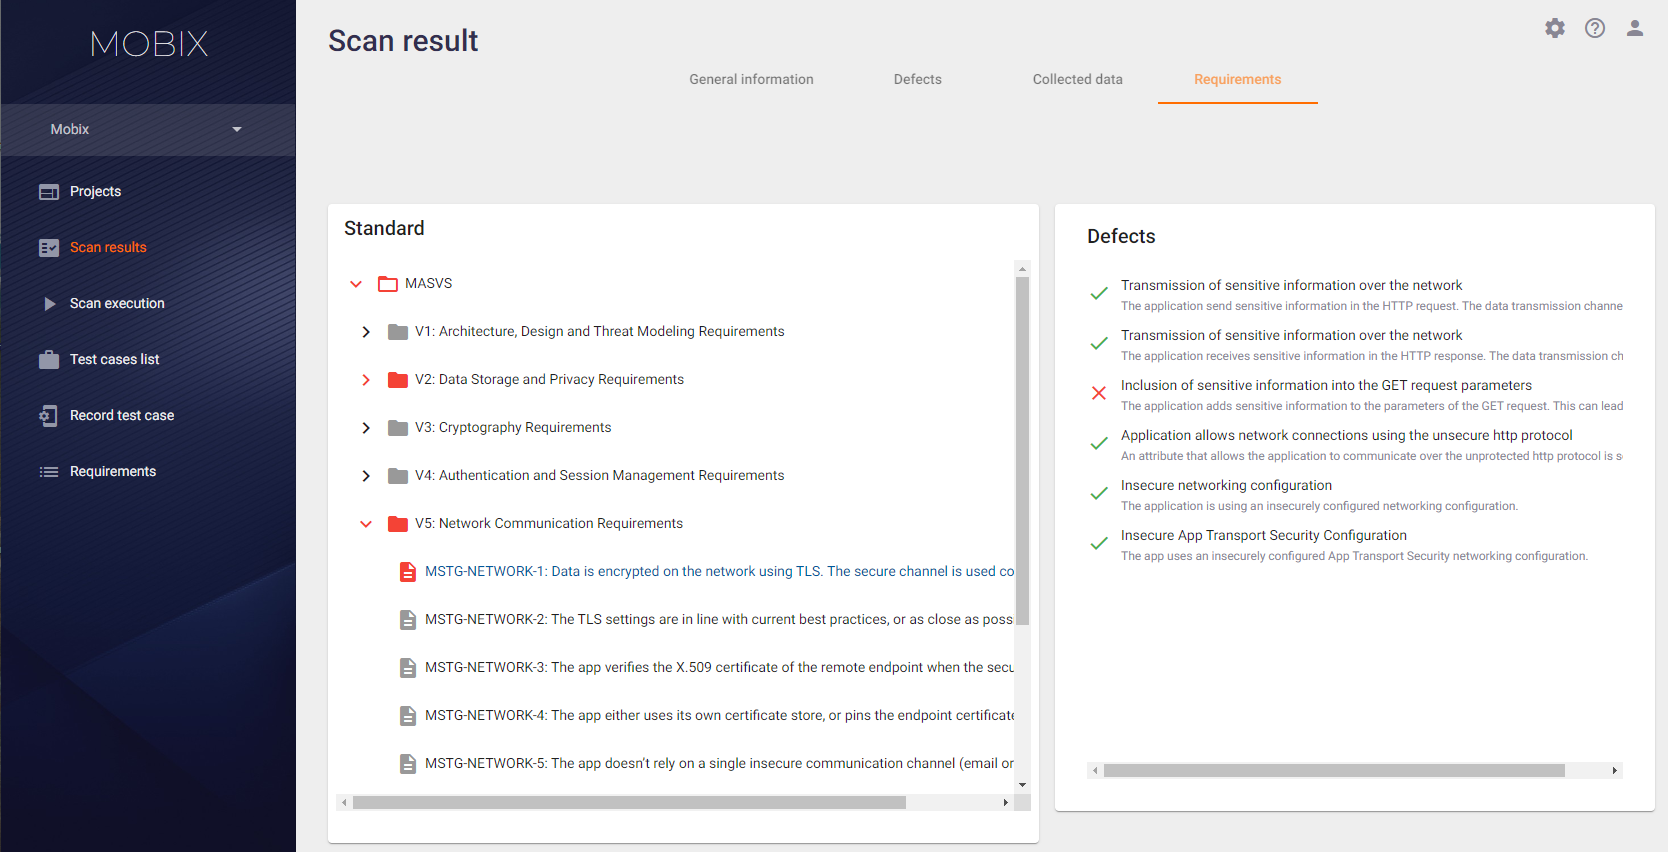
Requirements that have not been met are marked in red. If you click on an unfulfilled requirement in the Standard tab on the left side, the Defects tab on the right side will list the types of defects that have been checked for the selected requirement.
If at least one defect of a certain type was detected during the application scanning, this type of defects is marked with the  sign, and the requirement itself is considered unfulfilled and is marked in red. If no defects of a certain type were found during the requirement check, this type of defects is marked with the
  sign. A requirement is considered fulfilled if its inspection finds no defects among the types of defects relevant to that requirement.
On the right tab Defects, click a defect marked with the  sign to get the detailed information about found defects of this type:

To return to the requirements list, click the Back to requirements button in the upper left corner.
The Requirements tab contains data on compliance with the requirements of all standards selected in the scan profile. Suppose one more standard was added to the scan profile. In this case, the results of all scans previously performed with this profile on the Requirements tab will also show the correspondence between the previously collected scan results and the newly added standard in the profile.
View Video Record
This tab is only available for the results of auto scan and provides a video recording of the performed scan.
